Revenue

12%
FY 2012-13 to FY 2016-17
PAT
07%
FY 2012-13 to FY 2016-17
BOT assets
22%
FY 2012-13 to FY 2016-17
EBITDA
12%
FY 2012-13 to FY 2016-17
Net worth
13%
FY 2012-13 to FY 2016-17
 CAGR growth
Operating revenue break-up

40%
₹2,351Crs
Toll revenue
60%
₹3,495Crs
Construction revenue
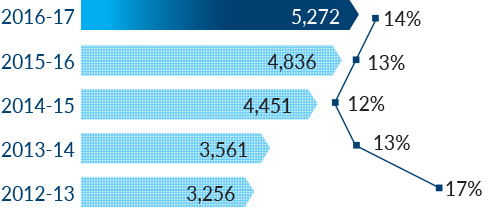
Revenues
(₹Crs)
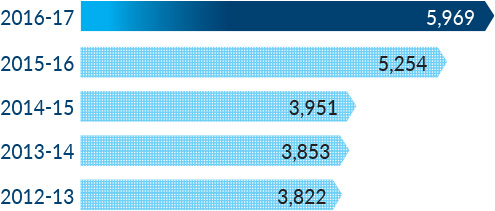
Revenues have risen consistently over the years driven by rising toll traffic, inflation linked tariff and number of operational projects and by rising construction order book contributing to higher construction revenue.
EBITDA (₹Crs) and EBITDA margin (%)
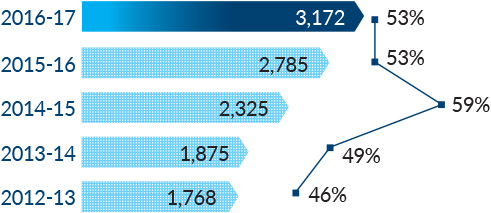
EBITDA margin
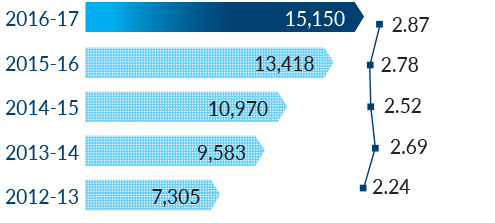
PAT (₹Crs) and PAT margin (%)
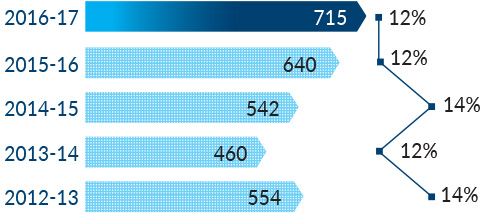
PAT margin
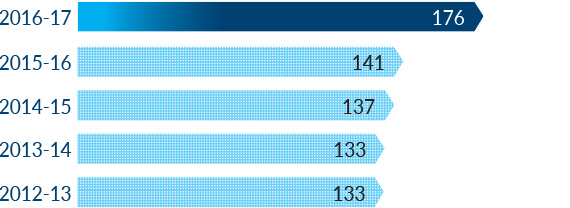
Earnings per share (EPS) and cash EPS (₹)
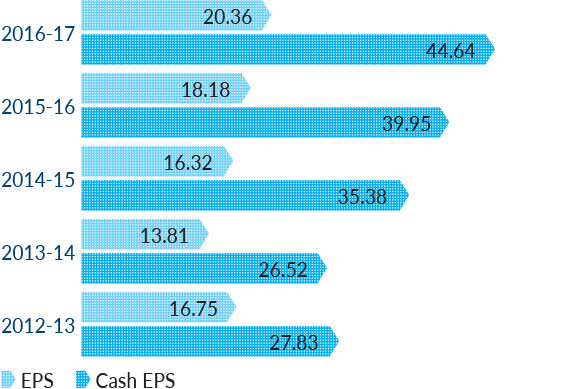
Increasing number of operational project assets has led to proportional increase in non-cash expenses like depreciation and amortisation resulting in growing cash EPS.
Net debt (₹Crs) & Net debt to equity ratio
Debt:equity ratio
Surging order book position, number of on-going projects and size of projects though contributing to rising revenues has led to increase in debts. However, post the Company’s transfer of six operational assets to IRB InvIT Fund along with its debt component aggregating to ₹3,358 Crs on May 9, 2017, the debt significantly reduced. As on May 30, 2017, the Company's net debt position stood at ₹9,720 Crs, while debt:equity declined to 1.81.
Dividend distributed
The Company has consistently focussed on giving more returns to the shareholders with rising profitability.
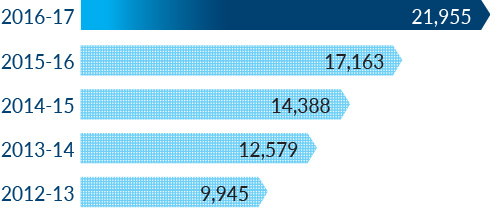
BOT assets
(₹Crs)
Capital employed (₹Crs) & Return on Capital Employed (ROCE) (%)
ROCE
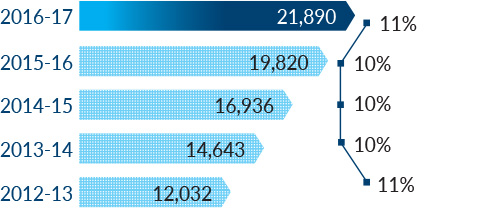
Net worth (₹Crs) & Return on Equity (ROE) (%)
ROE
With an increase in concession period of new awards from 12-15 years earlier to 25-28 years currently, the returns during the initial operational years are comparatively muted.